- Database(数据库)—创建与数据库的连接;
- Stream(流)—可以通过网络作为流接收,从文件打开或从数据库下载的多维数据集;
- Application code(应用程序代码:手动)—直接从应用程序代码填充数据库中的数据;
- Cube file(多维数据集文件)— 数据已包含在多维数据集文件中以及数据方案中。
<?xml version="1.0" encoding="utf-8" standalone="yes"?>
<slice version="2" timestamp="12.05.2017 16:31:09">
 <fields>
 <field name="OrderNo" caption="OrderNo" Width="0" Height="0" PopupWidth="120" PopupShowAvailable="False" Collapsed="False" CollapsedSubGroup="False"/>
 <field name="PartNo" caption="PartNo" Width="0" Height="0" PopupWidth="120" PopupShowAvailable="False" Collapsed="False" CollapsedSubGroup="False"/>
 <field name="Qty" caption="Qty" Width="0" Height="0" PopupWidth="120" PopupShowAvailable="False" Collapsed="False" CollapsedSubGroup="False"/>
 <field name="CustNo" caption="CustNo" Width="0" Height="0" PopupWidth="120" PopupShowAvailable="False" Collapsed="False" CollapsedSubGroup="False"/>
 <field name="EmpNo" caption="EmpNo" Width="0" Height="0" PopupWidth="120" PopupShowAvailable="False" Collapsed="False" CollapsedSubGroup="False"/>
 <field name="SaleDate" caption="SaleDate" Width="0" Height="0" PopupWidth="120" PopupShowAvailable="False" Collapsed="False" CollapsedSubGroup="False"/>
 </fields>
 <page_fields alignment="taLeftJustify">
 <fields/>
 </page_fields>
 <xaxis_fields alignment="taLeftJustify" GrandTotalPosition="fctp_Before" UseGrandTotalPositionFromMeasure="False" DefaultTypeSort="md_tsa_ByAxisValue" AxisType="at_Standard">
 <fields/>
 <AdditionalGrandTotals/>
 </xaxis_fields>
 <yaxis_fields alignment="taLeftJustify" GrandTotalPosition="fctp_Before" UseGrandTotalPositionFromMeasure="False" DefaultTypeSort="md_tsa_ByAxisValue" AxisType="at_Standard">
 <fields>
 <field name="SaleDate" caption="SaleDate" alignment="taLeftJustify" captionwidth="100" field_name="SaleDate" SortDirection="fcsd_Asc" TotalPosition="fctp_Before" UseTotalPositionFromMeasure="False">
 <AdditionalTotals/>
 </field>
 </fields>
 <AdditionalGrandTotals/>
 </yaxis_fields>
 <measure_fields alignment="taLeftJustify" caption="Measures" CaptionWidth="100" Region="X" Position="0">
 <fields>
 <field name="Qty" caption="Qty" alignment="taRightJustify" captionwidth="100" field_name="Qty" field2_name="Qty" fieldadv_name="Qty" AgrFunc="af_Sum" Visible="True" DisplayAs="da_Value" CalcAllCells="False" CalcAllCellsForTotals="False" Distinct="False" ChangeNullToZero="False" DefaultTotalPosition="fctp_After" UseDifferentAggForTotals="False" AgrFuncForTotals="af_Sum" CalcTotalsOnTotals="False" UseXAxisTotalsAsBase="False">
 <display_format Version="2" Name="General"/>
 <HIGHLIGHTS/>
 </field>
 </fields>
 </measure_fields>
 <topn/>
 <selection col="0" row="0" measure="0"/>
 <sortselection xlevelindex="0" xindexinlevel="0" xmeasureindex="0" xadditionaltotalindex="0" ylevelindex="0" yindexinlevel="0" ymeasureindex="0" yadditionaltotalindex="0"/>
 <options HideColZeros="False" HideRowZeros="False"/>
 <groups version="2" timestamp="12.05.2017 16:31:09"/>
 <filters version="2" timestamp="12.05.2017 16:31:09"/>
 <charts version="2" timestamp="12.05.2017 16:31:09">
 <chart_properties TypeChartData="tcd_ByAxisMeasures" CategoriesAxis="ar_RowAxis" SeriesAxis="ar_ColAxis" CategoriesFieldCount="1" SeriesFieldCount="1" MeasureFieldIndex="0" MarksShowStyle="ssNone" SkipNullPoints="False" Legend_Visible="True"/>
 </charts>
</slice>
这是一个简单的XML文件,从数据库中获取的字段在部分中声明,部分包含将在X轴上显示的字段。类似地,仅针对Y轴的部分是相同的,X轴和Y轴都包含测量字段,具体取决于多维数据的方向,部分包含字段度量。文本将此方案加载到多维数据集中,并使用数据库中的数据填充它。具体操作如下所示:创建一个WindowsForms应用程序,在项目引用中添加库:FastReport.Olap,FastReport.Bars,在安装了FastCube.Net的文件夹中找到:“C:\ Program Files(x86)\ FastReports \ FastCube.Net Professional”。然后将以下组件“拖”到工具箱中的表单:cube,dataSource,dbDataSet,slice,sliceGrid,oleDbConnection,oleDbCommand。

配置所有这些组件,连接到数据库:在oleDbConnection1属性中,将ConnectionString值设置为“Provider = Microsoft.Jet.OLEDB.4.0; Data Source =”C:\ Program Files(x86)\ FastReports \ FastCube.Net Professional \ demo.mdb“。继续执行组件oleDbCommand1,在其CommandText属性中,编写以下SQL查询:
SELECT items.OrderNo, items.PartNo, items.Qty, orders.CustNo, orders.EmpNo, orders.SaleDate
FROM (items LEFT OUTER JOIN
orders ON items.OrderNo = orders.OrderNo)
WHERE (items.OrderNo < 1100)
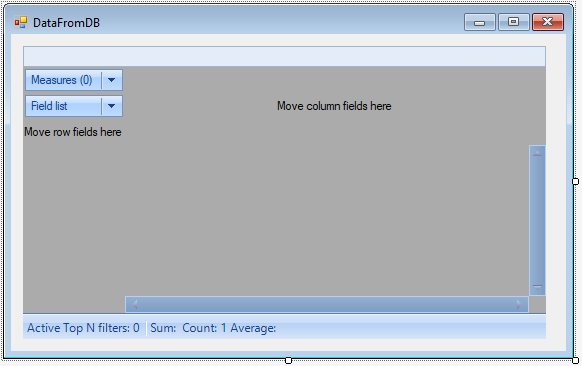
对于dbDataSet1组件,设置DbCommand属性— oleDBCommand1;DataSource1,选择DataSet— dbDataSet1;配置cube1,选择DataSource —DataSource1,SourceType是一个DataSource。对于slice1组件,只需要设置一个属性— cube(多维数据集),sliceGrid1组件是添加的唯一可视组件:

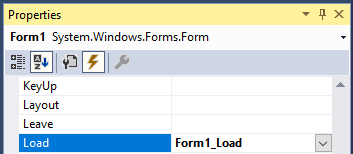
设置slice-slice1,为表单创建一个OnLoad事件处理程序:

并添加以下代码:
 private void Form1_Load(object sender, EventArgs e)
 {
 string filePath = "J:/Program Files (x86)/FastReports/FastCube.Net Professional/Demos/Data/Cubes/dataset_en1.mds";
 cube1.Load(filePath);
 cube1.Active = true;
 slice1.Load(filePath);
 }
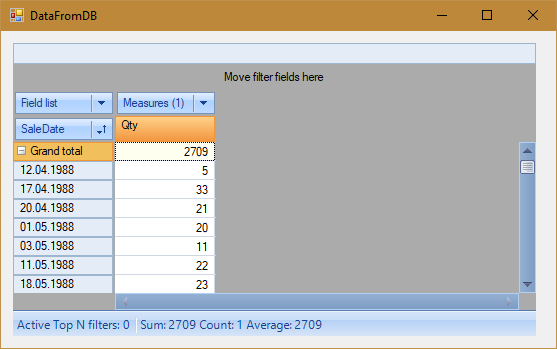
加载一个多维数据和一个切片,必须激活多维数据集,以便从数据库加载数据。现在启动应用程序:

因此,将多维数据集连接到数据库并不困难,可以通过手动创建跨表视图(通过拖动字段并使用鼠标进行其他设置),然后使用slice.Save()方法或单击“保存”来保存带有方案的mds文件。
本站文章除注明转载外,均为本站原创或翻译
欢迎任何形式的转载,但请务必注明出处,尊重他人劳动成果
转载请注明:文章转载自:FastReport控件中文网 [https://www.fastreportcn.com/]
本文地址:https://www.fastreportcn.com/post/2132.html
欢迎任何形式的转载,但请务必注明出处,尊重他人劳动成果
转载请注明:文章转载自:FastReport控件中文网 [https://www.fastreportcn.com/]
本文地址:https://www.fastreportcn.com/post/2132.html
 联系电话:023-68661681

 返回
返回